How to test all Git branches with Jenkins Pipeline
Written by Ferdy Galema on 5th July 2017
We like Jenkins very much. It’s an important CI tool for us to test our VoIPGRID branches. Jenkins offers a very rich ecosystem of third party integrations, by means of its plugins. For example, you can use Slack for feedback about job builds, or Amazon AWS EC2 for running Jenkins slave nodes.
This post explains how to setup Jenkins Pipeline for testing every Git branch in your project. I’ve created a basic template project with a typical Jenkins job configuration that you can adjust to your own needs. You can use your existing Jenkins installation, but I have included a simple introduction on how to start a Jenkins instance from your local workstation using Docker. This makes it easy to experiment without messing up production systems.

What is Jenkins Pipeline?
Not every pipeline is bad. Jenkins Pipeline basically makes it very easy to define a Jenkins job, by using a Jenkinsfile file that is checked in with your Git project. Jenkinsfile describes the individual build steps for every job, such as building, running unit tests and checking for common programming or style errors.
Before Pipeline, many configuration details were scattered on clumsy Jenkins job configuration pages. But now, since Jenkinsfile lives within your repository, most of your project-specific configuration is automatically versioned. And because of the powerful Groovy scripting language, many CI workflows are now much easier to implement (if it was not plain impossible before).
In addition to Pipeline, Jenkins now also features Blue Ocean, which is a complete user interface revamp. The previous UI of Jenkins is fairly dated, so Blue Ocean is a nice effort to further improve Jenkins. Not all screens are yet migrated, but for day-to-day tasks such as checking the status of a feature branch, it works great. Blue Ocean has been designed to work especially well with Pipeline.
Getting started with the project template
To get started with creating your own Jenkins Pipeline configuration, you may want to use our Jenkins-multibranch project template. It contains a basic Jenkinsfile and some tools for testrunning your CI workflows. It makes use of Docker and Docker Compose, so you should have those installed on your system. Make sure you are somewhat familiar with the basic Docker (Compose) commands.
You can either use the project template as a forked checkout or you can integrate the essential files in your existing project. Please read the installation instructions in the readme.
When you have the Jenkins instance running, go to http://localhost:8080/ to log in. Enter the password you see in the terminal where the up command is running. Choose the suggested plugins to get Jenkins going with some basic functionality (we’ll install this guide’s specific plugins in a moment). Finally, create a new admin user or simply keep using the existing ‘admin’ user (if you do choose to create a user, you need to fill out all fields, or the wizard fails silently with an exception in the terminal).
If anything goes wrong and you would like to start from scratch, you should stop the up command (just hit Ctrl+C in the terminal where it’s running) and remove the contents of the Jenkins home dir:
rm ci/jenkins_home/* -rf
Note that the directory itself must exist, otherwise the Jenkins Docker container cannot correctly initialize on the next start. With the contents cleared, you can (re)start the container by simply running the up command again. Play around a bit with Jenkins and the Docker container until you are comfortable enough with the basics to move on to the next step.
Go to Manage Jenkins → Manage Plugins and install the following plugins (or skip some if you already know you won’t use them):
- Blue Ocean
- Slack Notification Plugin
- HTML Publisher plugin
- Warnings Plug-in
- Checkstyle Plug-in
- Static Analysis Collector Plug-in
- Cobertura Plugin
(Three different ways to write “plugin”; so much for naming consistency..)
It is possible to have plugins automatically installed when starting the container for the first time. You have to extend from the jenkins image in your own Dockerfile and include a plugins.txt file. Change the jenkins service located in the ci/docker-compose.yml file to point to this custom image. The only caveat: you have to list EVERY dependency (including transitive dependencies) as well. This will makes creating the plugins.txt a real hassle, and the resulting file will be quite bloated and fragile. That is the reason I did not include this in the template. Check the Jenkins Docker Hub for more info.
Although Blue Ocean is not completely finished throughout Jenkins, this guide uses Blue Ocean interface wherever possible. If somehow the Blue Ocean link does not show up in the top Jenkins navigation bar, use http://localhost:8080/blue/ instead.
About the integrated Jenkins Docker container, I wouldn’t recommend using it for the actual deployment of your organization’s Jenkins. It’s just an easy and safe way to get familiar with Jenkins and testrunning your Jenkinsfile configuration.
A new job
From the Blue Ocean interface, create a new job (or “Pipeline”, as Blue Ocean likes to call it). The associated job type in the old interface is called “Multibranch Pipeline”. You can choose between type Git or type GitHub. Since GitHub is basically a superset of Git, this guide assumes type Git to have maximum compatibility with other Git hosting services. Although it probably won’t make much of a difference if you do choose GitHub.
Now set the URL of your project. For public projects, you do not have to use any credentials because Jenkins only needs read-only access. For private projects, in case you are having trouble authenticating: I’ve noticed that using the HTTPS Git URL in combination with the username/password credential works best, but your mileage may vary.
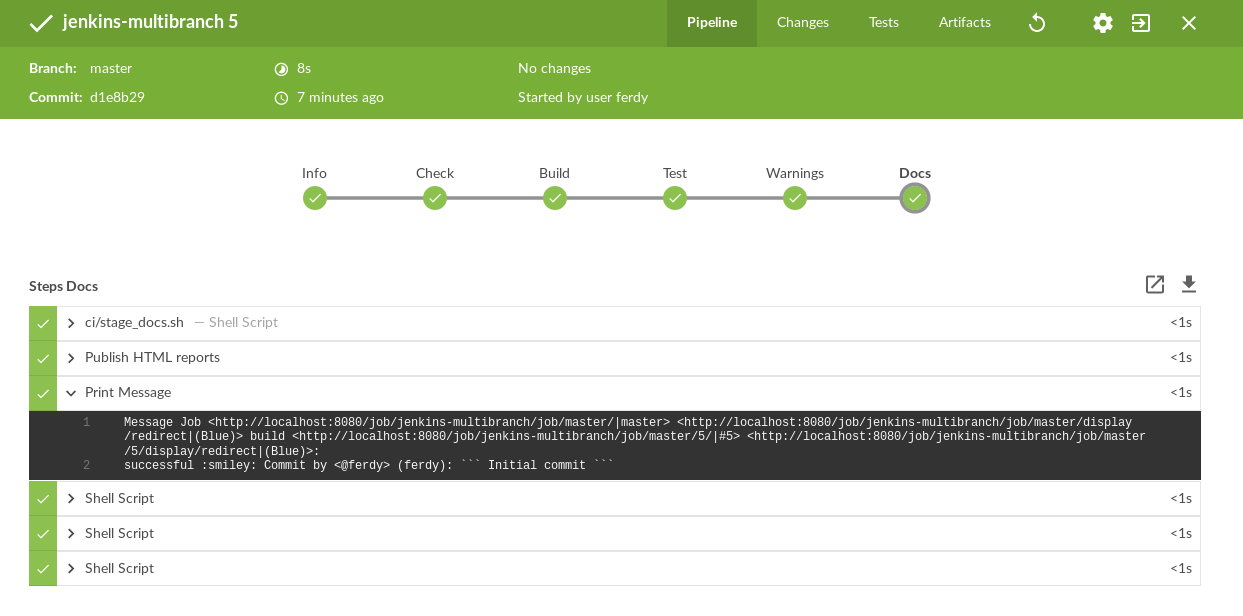
After creating the job, you’ll see the branches of the project containing a Jenkinsfile. The template has a Jenkinsfile for branch master, so you will see it on the pipeline’s main page. It should have also triggered an initial build named “Run 1”. Click it to see the build status or ongoing progress if it’s still running. You can see the stages and the steps for every stage, among other information about the build. Blue Ocean uses SSE (Server Side Events) for really fast page updates. This is how a successful run should look like:
If you have a build failure, you are probably missing a plugin or two. Either remove the offending snippet from the Jenkinsfile or install all required plugins (as mentioned before).
Because we want to automatically trigger builds for new branches and new commits for existing branches, we need to make some changes to the job configuration. Although it is possible to configure push events to trigger builds, by far the easiest and most reliable way is to actually use polling. Also, it is totally independent of the Git hosting service you are using. Click on the configuration icon on the job’s main page. At time of writing, this switches back to the old UI. Scroll down to “Scan Multibranch Pipeline Triggers” and check “Periodically if not otherwise run” using the default of 1 minute. Hit Save and from now on every new branch and commit will trigger a build within at most one minute! Try to create multiple branches with dummy commits to verify that Jenkins indeed builds them all.
As an alternative to configuring polling in the Jenkins job settings, there is a Jenkinsfile triggers section available. With this you also have the option to enable polling and other rescheduling options. I’m not sure how well this plays with multiple branches or changes to the triggers value during development. In any case, for me it made the most sense to put this aspect outside of the Jenkinsfile.
“Groovy Baby”
Jenkinsfile is the heart of the Pipeline setup and is based on the Groovy language. It is sometimes referred to as “Pipeline as code”. It offers both a scripted and a declarative format. We use the declarative format because it is easier to read and maintain. The declarative format can still contain scripted snippets, more on that below. For a full comparison, check the Jenkins docs.
Groovy is based on Java yet much more dynamic, making it a great choice for expressing CI logic in small and powerful snippets. Below is a snippet to get an impression of the syntax. For more examples, check out this very complete cheat sheet.
times = 3

map = ['who': 'world']

for (i in 1..times) {

    // No need to import Date; Groovy does some default imports!

    println "Hello ${map['who']}! It is now ${new Date()}."

    sleep 1000 // 1 sec

}
The Jenkinsfile contains a definition of the stages and the steps. The Jenkinsfile in our template project uses several bash scripts that are called during various stages. Note that the files are executed with the project directory as working directory, not the ci directory. You can also declare the contents of the bash scripts inline, but putting them in separate scripts makes it more modular and you can have syntax highlighting in your editor. Along with bash scripts, there are the Groovy script snippets. These are defined in script nodes.
When the Blue Ocean view does not show exactly why/where a job has failed, you should switch to the old UI with the top-right arrow button. I have noticed that certain programming / syntax errors in the Jenkinsfile (such as invalid nested node types) are not always clearly visible in the Blue Ocean interface. The “Console Output” section in the old UI shows a full log of the pipeline build, identifying all possible errors. As an alternative, you can go the Blue Ocean’s Artifacts section, which also shows this log.
Some builds can fail because of permissions that need to be granted. Head on to the In-process Script Approval screen and approve the permissions. Every time you change the Jenkinsfile where you access certain classes, you will have to grant them on the approval screen after running the script (and seeing it fail). Yes, this is quite painful, and there does not seem to be any way around it at the moment. Check this ticket for more info.
It’s good to know that the declarative syntax almost supports running some stages in parallel. This is useful to speed up the total job time. For example, you could combine the test, warnings and docs stages, if they work independently of each other (usually they will). Keep track of this ticket to know when it’s available.
To branch or not to branch
It is useful to know what the range of commits is that a certain feature branch holds. The template uses this list of commits in the Slack notification (more on that later). “Feature branch” in this context means every temporary branch that should be CI tested. To do so, the template determines the “ancestor commit” of every branch. This is defined as the commit where the branch is created from the parent branches, such as develop, master etc. Those ancestor branches are defined in the template. Note that beside master and develop, there is one more type in the template: epic. We use epic branches as a temporary develop branch, for the purpose of working on bigger features (or milestones) that are actually compromised of several individual feature branches. So it is like a temporary develop branch that gets merged back to actual develop when the milestone is finished. Adapt this to your own Git workflow.
An advantage of having the ancestor commit is that we can check if the feature branch actually has any new commits at all, or if it’s a freshly pushed branch without any commits yet. The template aborts the build when this is the case. This might save some resources on the CI machines, especially if the CI pipeline is expensive to run.
Slack feedback
Uncomment the “slackSend” statement to send a message to a Slack channel after a build. Do not forget to forget to update the parameters “channel” and “teamDomain”. The template sends a message for every status, but you can change this by using a “changed” node in the “post” node. This will only send messages when a build status has been changed, for example from SUCCESS to FAILURE.
A Slack token should be configured in the Jenkins system settings, to prevent having it in your source code (and thus the repository). It’s considered bad practice to keep secrets in code. Create such a token in Slack by going to Slack’s “Apps & Integrations” and selecting the Jenkins integration followed by “Add Integration”. These steps are pretty straightforward.
If you want to have links to the job builds in the message, you must also configure a domain the Jenkins system settings. The setting is named Jenkins Location / Jenkins URL. If you keep it at the default or empty, the message will contain “null” values for the env.JOB_URL and env.BUILD_URL entries. Using the setting http://localhost:8080/ seems to work, though only if change it to another value (hit “Apply”) and back again to trick Jenkins into thinking you have changed the default value!
There are four links used in the message (you should leave out the ones you don’t use):
- $JOB_URL – the old interface job page
- $BUILD_URL – the old interface build page
- $JOB_DISPLAY_URL – the Blue Ocean job page
- $RUN_DISPLAY_URL – the Blue Ocean build page
Besides the build status and links to the builds, the Slack message also shows the latest commits. It uses <@${author}> formatting in the message, meaning that if your git author name equals your Slack short name, you get an automatic mention in Slack. Otherwise, you can create a custom notification in Slack based on your Git commit name if you want Slack mentions.
Some Docker (Compose) tips
The template project uses Docker Compose for running Jenkins. If you use Docker Compose for your project itself (for example you run tests in a Docker container), you get some very long Docker image names by default. Why? Because Compose uses the following name format {projectdirectory}_{service name} for images. This is somewhat annoying because Jenkins creates workspaces (thus project directories) with a long randomly generated “hash” per branch. Not really insightful when you are browsing the locally built Docker images on the Jenkins for debugging purposes.
What you can do is set the COMPOSE_PROJECT_NAME env variable prior to running any Compose command and set this to the value “${env.BRANCH_NAME}-${env.EXECUTOR_NUMBER}”. This simply uses your branch name in addition to the EXECUTOR_NUMBER, meaning that if you run multiple builds of your branch simultaneously, they will not collide in the namespace! Somehow it is not allowed to set this variable with the declarative way, so the template uses the scripted variant.
You might be tempted to include the build number such as using BUILD_TAG, but this explodes the number of images very quickly, as every build will be unique.
To prevent every container from taking up too much space, you can run commands with the –rm flag so that the container is removed after running. It is also recommended to stop all containers using the docker-compose stop or kill command, or if you really want to clean everything after every build: docker-compose down (deletes containers/networks, see –help for more info). Such a cleanup command fits nicely within the (post) always node.
I’m aware of the many Docker plugins for Jenkins, but for maximum flexibility, I like to simply call docker and docker-compose in the various scripts. I tried to the agent docker declaration for running some Docker containers in the Jenkinsfile, but I wasn’t too convinced of its utility. Also, the syntax confused me. Therefore, running Docker commands from a bash script or directly in a sh step works currently the best for us.
The last Docker tip I like to give is workspace directories. Running a command in Docker results in a different workspace directory than the Jenkins workspace (where your project is checked out on the Jenkins machine). This may confuse tooling. For example the coverage.xml contains an absolute source path; the Cobertura plugin will not show source code when you view the coverage in Jenkins. A solution is to rewrite the directory after this coverage.xml is generated, by processing the output file with sed. There is an optional snippet in the template that demonstrates this (search for “sed” to locate).
A warning on “warnings” and HTML reports
The template contains a “warnings” stage. Such a stage typically runs a few external static analysis tools, for example PEP8 / Flake8 for Python and ESLint for Javascript. The template generates some dummy warnings for demonstrative purposes.
The problem is that Blue Ocean does not seem to support warnings yet. Go to the old UI to see them appear on the build’s page. The branch main page (the one listing all builds for a single branch) shows trend graphs. I think it’s a matter of time before Blue Ocean adds support for it.
The same goes for publishing miscellaneous reports. Blue Ocean shows nothing, even though the template generates a “docs” section for every build.
One additional note about static code analysis: there are several plugins that seem to add some functionality for this, and it took me some time to figure what plugin exactly does what. So here’s an overview:
The CORE static analysis plugin, providing the basic functionality for all extending plugins:
https://wiki.jenkins-ci.org/display/JENKINS/Static+Code+Analysis+Plug-ins
Several static analysis implementations, featuring several languages / analysis tools, such as:
- Warnings (supports many analysis tools): https://wiki.jenkins-ci.org/display/JENKINS/Warnings+Plugin
- Checkstyle (another popular plugin, for the checkstyle format): https://wiki.jenkins-ci.org/display/JENKINS/Checkstyle+Plugin
And finally there’s the Analysis Collector Plugin: https://wiki.jenkins-ci.org/display/JENKINS/Analysis+Collector+Plugin
The collector is able to combine the several implementations into a single graph. You might ask, why do we need several static analysis implementation plugins? The reason is that some plugins only support some of our required tools. For example, Warnings supports flake8 (by using the type pep8) and eslint (by using the type jslint). However you can only use every type once, so if you have another jslint-typed warnings file, you are screwed! If you’re lucky you can change the output type per tool, so instead of outputting type jslint you can choose another format that’s still available. It happens that the format checkstyle is supported by quite some tools, so we simply “abuse” this type as a placeholder for a tool that outputs a different native format.
Conclusion
I hope this guide helped to get you started on using the Jenkins CI with the recently added features. I realize some aspects are not very intuitive at all. Especially the transition to Blue Ocean is not without pains, because of the incomplete implementation and the limited support of many plugins. But I do think it’s already great for day-to-day use by developers simply wanting to test their feature branches.
Also, I must say the static analysis plugin ecosystem is quite messy. If you rely a lot on static code analysis, I recommend keeping an eye open on the progress of this in Blue Ocean.
All in all, I think Jenkins Pipeline works great to define a custom CI workflow.
Thank you for reading, if you have any questions or other comments, feel free to drop them below.

Your thoughts
No comments so far